Market Data Bank
On June 13, 2022, the S&P 500 dropped more than 20% from its January 3, 2022, all-time high.
Inflation, Russia, and the pandemic could send stocks tumbling further, and it’s a time of high financial anxiety.
This presentation provides performance data framed from the perspective of a financial professional.
2022 had already been a bad year for investors before the bear market officially began on June 13th..
Inflation for months has been running at its highest rate in four decades, and the European Union’s ban on Russian oil, along with a decrease in oil production by OPEC. Energy prices could head higher this winter.
Stocks posted a loss of -4.9% in the third quarter, fo0llowing a -16.1% loss in the second quarter of 2022, which followed a -4.6% loss in the first quarter of 2022.
The extraordinary events we’ve all been living through since the start of 2020 have whipsawed investors.
In the first quarter of 2020, the S&P 500 plunged.
The -19.6% loss in stocks that quarter was actually much worse than it appears in this table.
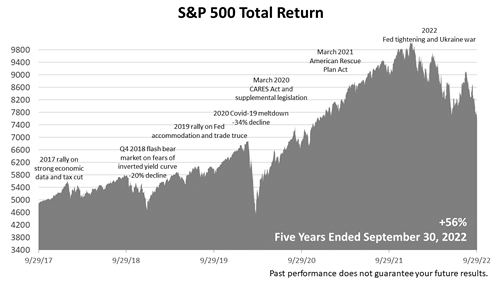
Looking back at the price chart, at the tail end of the first quarter of 2020, stocks had declined by as much as -34% on March 19, 2020, before rebounding to end the quarter with a loss of “only” -19.6%.
That big bear market loss set the stage for a spectacular seven-quarter bull market run that peaked January 3, 2022.
Stock prices soared every quarter from the second quarter of 2020 to the end of 2021.
This was followed by three straight losing quarters in 2022.
Let's talk about stock market volatility because we've seen some extraordinary volatility lately.
And the point that I'll repeat today is: Remember the basic axiom of investing in common stocks.
It's that volatility goes with the territory. If you want the so-called equity risk premium, then you have to expect stock market volatility and, in fact, welcome stock market volatility.
Because without volatility, you wouldn't get the 6-percentage-point excess return over fixed income that we've gotten from common stocks in the long term.
The nominal return on common stocks has been about +10% over the long term, and the number in fixed income has been about 4%. And, again, that’s nominal, not a real, after-inflation return.
So 6 percentage points is the equity risk premium, and the only reason you get that is because you've exposed a portion of your portfolio, the stock portion of your portfolio, to volatility.
So, it's just so important to be able to explain to people, “Yes, we've entered a period of heightened volatility here. You can see that volatility is up, generally, from where it was.
We had an extraordinary period of low volatility for a number of months last year. Volatility is surging, and we don't like it when stocks are down 600 or 800 points on the Dow. But without that periodic cleansing, if you will, you wouldn't get the long-term returns that we've gotten in stocks.”
As the bear market grinds on and portfolio statements are a little frightening to look at, it can make you wonder if stocks are worth the risk?
Here’s the answer.
The equity risk premium measures the reward received for tolerating the risk of owning stocks, and it’s an important investment metric to remember in bear market moments like this.
Illustrated here, is the average annual equity risk premium for the 20-year period ended September 31, 2022
Stocks, as measured by the Standard & Poor’s 500, averaged a 9.8% annual return in the 20 years — more than seven times the 1.2% annual return on risk-free 90-day U.S Treasury bills.
T-bills are considered a risk-free investment because they’re backed by the full faith and credit of the United States Government.
In contrast, stock market investments are not guaranteed.
Stock prices fluctuate, depending on the economy and investor sentiment and are subject to unpredictable swings up and down.
In theory, if all 500 blue-chip companies in the S&P 500 index were to go bust, your entire investment would be lost.
So that’s why stocks are considered risky.
Subtracting the annual return on T-bills from the return on stocks, the resulting 8.7% is the premium paid annually for taking the risk of owning U.S. stocks over the 20 years.
To be clear, investing in America’s 500 largest publicly held companies in the past 20 years earned an average of 8.7% more annually than a risk-free investment.
This 20-year period encompassed four bear markets — the tech crash of 2002, the financial crisis of 2008, the COVID downturn of February 5 through March 23, 2020, and the current post-Covid downturn now under way, so investors were subjected to plunges of more than 30% in the worst bear markets.


